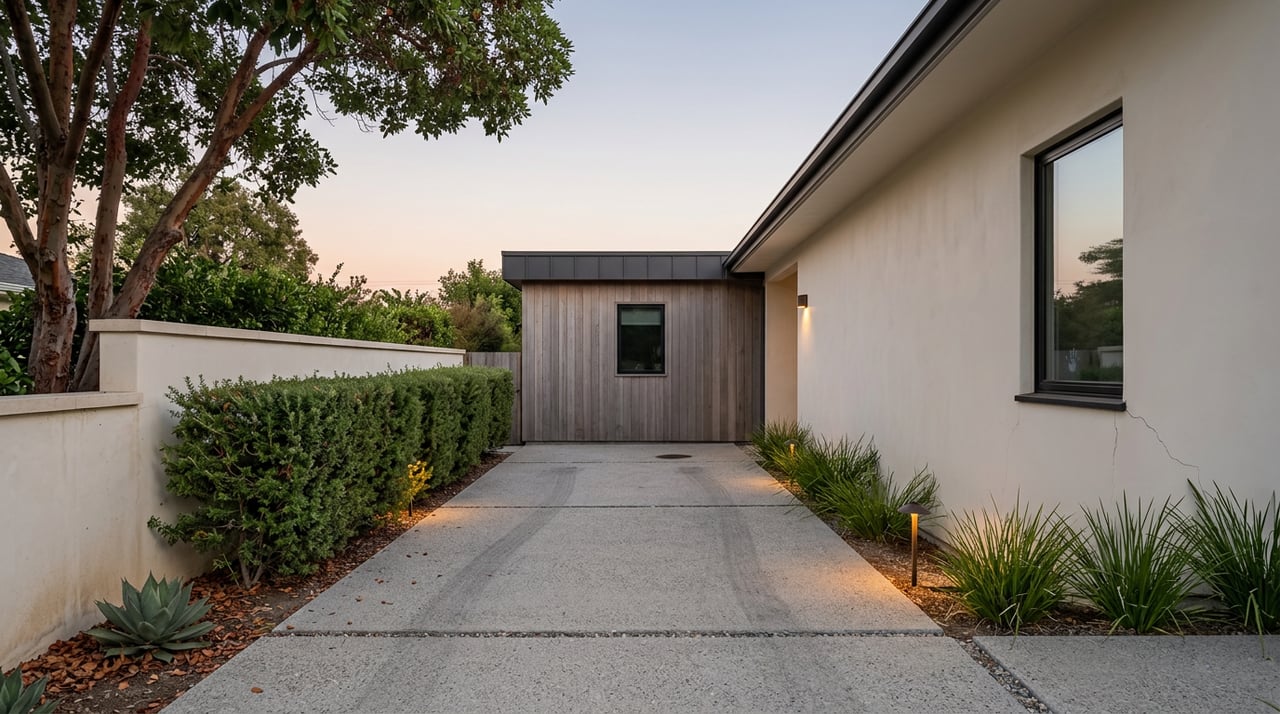
The May 2026 sales data complicate the assumption that price alone predicts how hard it is to win a Palo Alto home. Midtown and Barron Park ranked among the city's most competitive neighborhoods, and Barron Park homes sold fastest and for the most over asking. It's a neighborhood best known for having no sidewalks and a pasture full of donkeys.
Palo Alto's citywide median sale price sat at $3.6 million over the three months ending in May 2026, with homes averaging 12 days on market and drawing about three offers apiece. That's the number most buyers see first on a portal search, and it's the number most comparison shoppers anchor to before they've toured a single house. It's also the number that hides almost everything useful.
The Median Hides a Wide Price Spread
Break that $3.6 million citywide figure down by neighborhood and the range stretches from roughly $1.1 million in Green Acres to just over $9 million in Old Palo Alto, based on May 2026 sales data. That's not a rounding difference. That's two different housing markets wearing the same zip code.
The Green Acres number deserves a caution flag of its own. Only four homes sold there that month, which means a single unusually small or unusually updated property can swing the median hard in either direction. The same caveat applies at the other end of the market: Old Palo Alto had 18 sales in May 2026, a healthier sample, but still small enough that one estate sale or one architecturally significant teardown lot can move the needle by hundreds of thousands of dollars.
This is the first thing a comparison shopper needs to unlearn. The citywide median is a decent gut check for what Palo Alto costs in general. It tells you almost nothing about what you'll actually be competing against in a specific neighborhood, because "Palo Alto" isn't one market. It's a dozen small ones stitched together under one municipal boundary.
Where the Bidding Actually Gets Fierce
Here's where it gets interesting for anyone shopping by feel instead of by data. Redfin's Compete Score, which blends days on market, sale-to-list ratio, and offer activity into a single competitiveness read, ranked Midtown and Barron Park among the most fought-over neighborhoods in the city during this window, ahead of pricier, more prestigious addresses.
| Neighborhood | Median days on market | Sale-to-list ratio | Compete Score |
|---|---|---|---|
| Midtown | 10 | 105.3% | 97 |
| Barron Park | 8 | 112.2% | 91 |
| Charleston Meadow | — | — | 90 |
| University South | 21 | — | 57 |
Barron Park homes sold at 112.2 percent of asking, with a median of eight days on market. Midtown wasn't far behind at 105.3 percent of asking, with a median of ten days on market and 28 recorded sales that month, more transaction volume than any other neighborhood in the comparison, including Old Palo Alto's 18. University South, despite carrying a price tag that puts it well above the citywide median, managed only a "somewhat competitive" score and had a median of 21 days on market, roughly double Barron Park's pace.
In plain terms: buyers are fighting harder over homes in Barron Park and Midtown than they are over homes in University South, even though University South costs more per square foot. Price and competition have come apart.
Why the Two Numbers Split
A few things are driving this, and none of them are mysterious once you see the neighborhoods up close.
Barron Park is Palo Alto's outlier by design. Lots there range from around 5,000 square feet up to well over an acre, the streets famously lack sidewalks and curbs, and the neighborhood centers on Cornelis Bol Park, home to a small pasture of donkeys that residents have looked after since the 1930s. One of them, Perry, is often cited locally as the model for the donkey character in an animated film. The Barron Park Association hosts a May Fete Festival at Bol Park every spring, along with ice cream socials and a Halloween parade residents call the Bray Parade. That combination, semi-rural character, unusually large and varied lots, and an active neighborhood association, creates a product buyers can't replicate elsewhere in the city. When something that specific comes on the market, buyers who want it tend to want it badly, and there's no substitute two neighborhoods over.
Midtown's competitiveness runs on a different mechanism: volume and walkability. It's one of the few pockets of Palo Alto with a real concentration of attached housing, from mid-century low-rise condo buildings to newer townhome clusters, within an easy walk of California Avenue's restaurants, farmers market, and Caltrain stop. That draws a wider buyer pool, first-time buyers, downsizers, people who want single-family character without a single-family price tag, and a wider pool chasing a limited number of listings each month tends to push days on market down and sale-to-list ratios up.
University South's slower pace likely reflects a narrower, pickier buyer segment. Higher price points naturally shrink the pool of qualified buyers, and a smaller pool takes longer to produce a serious offer, even when the homes themselves are excellent.
There's a fourth factor that rarely shows up in portal search filters but matters just as much: Palo Alto Unified assigns students based on home address, and transfers into or within the district are limited and subject to space. Buyers with school-age kids don't just shop by price. They shop by attendance boundary, and that can concentrate demand into a specific pocket of a neighborhood regardless of what the broader area's median suggests. Two houses ten minutes apart can feel like they're in entirely different markets once you factor in which elementary school each one feeds into.
What This Means If You're Comparing Neighborhoods
If you're using the citywide median as your starting point for a Palo Alto search, treat it as exactly that: a starting point, not a strategy. A few practical adjustments:
Look at neighborhood-level days on market and sale-to-list ratio before you assume a lower price point means less competition. Barron Park and Midtown prove that the opposite can be true.
Be skeptical of any single month's median in a low-volume neighborhood. Four sales in Green Acres or two in Ventura is not enough data to draw a firm conclusion about pricing trends there. Ask for a longer trailing window before you anchor your expectations to one month's number.
Factor in your own timeline for staying put. If school boundaries matter to your household, understand that the district doesn't make it easy to move within Palo Alto later and keep your current school assignment. That should shape which neighborhood you prioritize touring, not just which one shows the lowest median.
Expect a stronger offer strategy in Barron Park and Midtown than the sticker price alone would suggest. A sub-$3 million Barron Park bungalow with the right lot may draw more competition than a $6 million home in a quieter, lower-volume pocket of the city.
The broader Peninsula has shown the same pattern of localized divergence recently. A weekly roundup of Midpeninsula home sales published in early August 2026, covering closings recorded from mid-June through early July, showed a sharp split between luxury-driven medians in places like Los Altos Hills and more moderate activity elsewhere on the same list, the kind of week-to-week variance that reinforces why a single areawide number rarely tells the whole story.
A Few Common Questions
Does a lower median price always mean an easier purchase? Not in Palo Alto, based on May 2026 sales. Barron Park and Midtown, both well below the citywide median, posted tighter days on market and higher sale-to-list ratios than pricier University South. A lower price point can still mean a harder fight for the house.
How much should I trust a single month's neighborhood median? Treat it carefully anywhere the sales count is in the single digits. Green Acres and Ventura each closed fewer than five homes in May 2026, which is too small a sample to anchor a firm pricing decision on.
Can I buy in one Palo Alto neighborhood and switch my kids' school assignment later? Generally, no. Palo Alto Unified assigns by home address, and transfers within the district are limited and depend on space availability. If school boundaries are a priority, factor that into which neighborhood you tour first, not last.
If you're trying to figure out which Palo Alto pocket actually fits your budget, your timeline, and your must-haves, a citywide average won't get you there. The Fallant Team works these micro-markets block by block, and we'd rather walk you through the real numbers for the neighborhoods on your list than let a headline median make the decision for you. Schedule a consultation and let's look at what's actually happening on the streets you're considering.
This article is general information, not legal, tax or financial advice. Consult a qualified professional about your situation.